algorithmic modeling for Rhino
Narrative Diagram Challenge
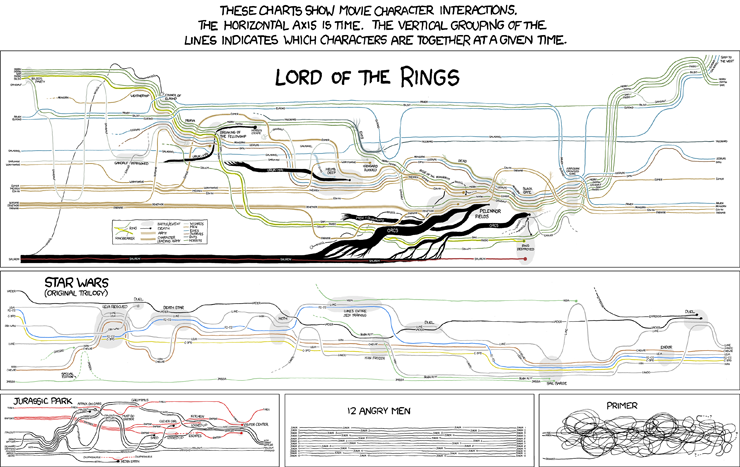
A "fun" challenge for you all here... something I've been trying to crack for a few months, but still haven't quite got it. (The data-tree manipulation has thrown me).
Basically, I want to be able to recreate the diagrams shown here for any set of 'collaborators' in a time-based narrative.
I have some basic ideas on how to do this, but I'm looking for alternative approaches. Does anyone have any thoughts?
Thanks!
Views: 459
Replies to This Discussion
-
Permalink Reply by David Stasiuk on
-
What does your data look like?
-
-
Permalink Reply by Evan C on
-
David, here's an example. (using Excel Read component from Lunchbox):
The data coming from excel is formatted as follows: in the data tree, path {x} corresponds to the excel column, item (n) corresponds to the row.
- Attachments:
-
-
 Collaborator Diagram.xlsx, 12 KB
 -
Collaborator Diagram.gh, 22 KB
-
-
About
Welcome to
Grasshopper
Translate
Search
Photos
Videos
-
Ngon Mesh
Added by Parametric House 1 Comment 0 Likes
-
Minimal Surface
Added by Parametric House 0 Comments 0 Likes
-
Wind Pavilion
Added by Parametric House 0 Comments 0 Likes
© 2026 Created by Scott Davidson.
Powered by
![]()