algorithmic modeling for Rhino
Grid Based Analysis - Honeybee Object Question
First of all, the work you are doing is fantastic.
I'm trying to get some geometry to work in the grid-base analysis example file. It seems that the only geometry that will be accepted are surfaces that can be joined into a solid. Is this by design?
When ever a set of surfaces can't be combined into a solid, it fails to produce results. I have a complex building lighting situation, where the daylight strategy relies on a central atrium to achieve lighting levels. I'm struggling to get the geometry to be properly converted into Honeybee geometry. Anybody have any suggestions?
My larger objective is to do some preliminary daylight analysis to see where a project stands on LEED IEQ 8.1. Is the grid based analysis example script the best place to start in building a script for this? As you can tell, I'm using the grid based analysis to get a daylight factor for a space that has been previously modelled, rather than parametrically defined. I'm also more interested in Lux readings than daylight factor, but this seems to be an easy modification.
I know there are multiple questions here, but the main question is about the Honeybee object, and why the analysis fails when they aren't solids.
Thanks.
Views: 5200
- Attachments:
-
-
 daylight modeling.3dm, 1.8 MB
-
Replies are closed for this discussion.
Replies to This Discussion
-
Permalink Reply by Mostapha Sadeghipour Roudsari on
-
Hi Will, Thanks-
For daylighting you don't need to have a closed brep/solid.
Yes. You should use grid-based analysis and you can get the illuminance values by setting the type of the analysis to illuminance. Check the attached file for an example with your buildings.
Also it will be much easier to help if you upload your Grasshopper definition.
Mostapha
- Attachments:
-
-
illuminanceAnalysis.gh, 226 KB
-
-
-
Permalink Reply by Will Krzymowski on
-
In the file I attached, the building on the left failed to produce results, while the one on the right worked. I made some simple examples, and it seemed to fail when there were holes. Like the windows didn't line up with the wall openings etc. I'll try and recreate the test examples and upload them in the morning.
Thanks for the quick response Mostapha.
-
-
Permalink Reply by Ethan on
-
Mostapha,
Thanks for the incredible tools. I am trying to understand how to use this type of definition to determine percentage of occupied space filled with a certain level of FC daylight.
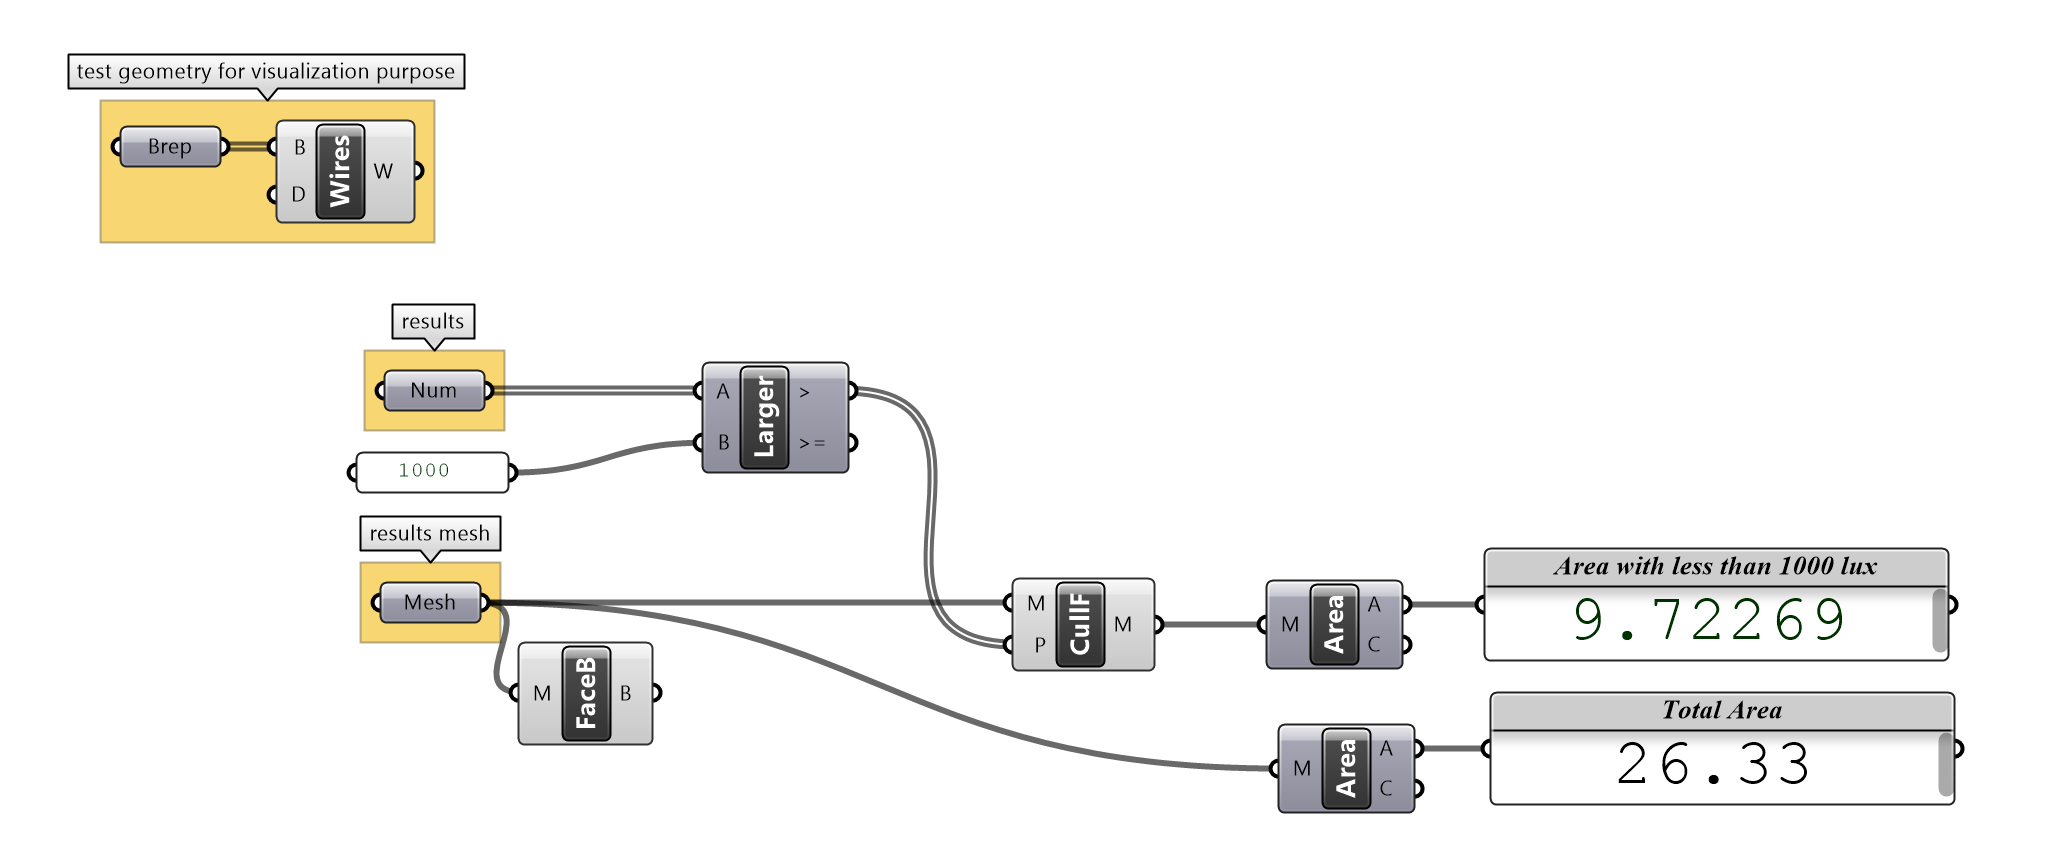
I would like to calculate the percent of space filled with a certain level of light. I dispatch the illuminance values and divide them by the total number of values. I believe this is correct? however I would like to display the area that has the level of exposure and am not sure how to do that. Is there a good way to do this?
Also when I set the bounds off the legend parameters to the actual bounds of the illuminance values I get a very limited display of light. I want to be sure I am displaying the correct colors ... can you advise? Thanks again! -Ethan
- Attachments:
-
-
illuminanceAnalysis_02.gh, 243 KB
-
-
-
-
Hi Ethan, Have you seen this Hydra. You can use cullFace component to remove mesh faces that doesn't meet the criteria.

-
-
Permalink Reply by Pedro on
-
Hi everyone,
In the grid based analysis, is it the weather file direct and diffuse illuminance used to calculate the illuminance on the surface or the sky generated with the generate climate based sky uses other factors to calculate the illuminance?
I am trying to do a parametric study on how different direct illuminance with same angle varies the illuminance in a space. But I get similar results for every simulation.
I wouldn´t mind to use an annual DA simulation but it is a waste of time if I can get the simulation for just one hour.
Thank you for your replies!
Pedro
- Attachments:
-
-
psilluminancevariation.gh, 88 KB
-
-
-
-
Hi Pedro,
Yes. The climate based sky uses the data from the weather file to generate the sky.
Mostapha
-
About
Welcome to
Grasshopper
Translate
Search
Photos
Videos
-
Field Dendro
Added by Parametric House 0 Comments 0 Likes
-
Sphere Collide
Added by Parametric House 0 Comments 0 Likes
© 2024 Created by Scott Davidson.
Powered by
![]()